Methane Review Panel Submission, MSA & Groundswell
for Methane Science Accord & GroundswellAspects Covered
• GWP, GWP* & GTP
• Absorption of infrared at ground level
• Above the surface
• Emissions height and above
• Forcings
• Converting Forcing to Temperature
• Feedback
• Climate models
• Lifetime of GHGs
• Future projections of methane
• Warming effects of radiation from methane
• Peer review
• References
• Appendix - calculations of feedback and conversion to temperature
“The Methane Science Accord and its partners wish to acknowledge the debt that farmers have to the work of the late Dr Jock Allison.”
GWP GWP* GTP
These are the metrics used to compare the efficacy of the various greenhouse gases.
There are several issues with this metric;
1. The use of mass
The comparison often made is that a tonne of methane is some 28 times worse than a tonne of CO2.
This ignores the fact that absorption of infrared is a molecular property, the comparison should be between equal number of molecules (moles).
A given mass of methane contains 2.75 times more molecules than the same mass of CO2. This distorts the issue from the outset regardless of the radiative properties of the GHGs being compared.
This needs to be corrected
2. The major difference between CH4 and CO2 is in the effect of concentration. At very low concentrations an increase in any GHG will have a significant effect while for gases which are saturated the effect will be minimal.
In the diagram (below) the red triangles all have the same increase in ppm but the increase in absorption is vastly different.
Above 200 ppm CO2 would be considered saturated.
Saturation being the point where CO2 has absorbed virtually all the radiation from the Earth (that it is able to absorb) so adding more CO2 has little effect.
The issue is that using this metric ignores the fact that while the per molecule forcing might be 30 times or whatever, the concentration is so small that the actual effect on absorption of radiation is minimal.
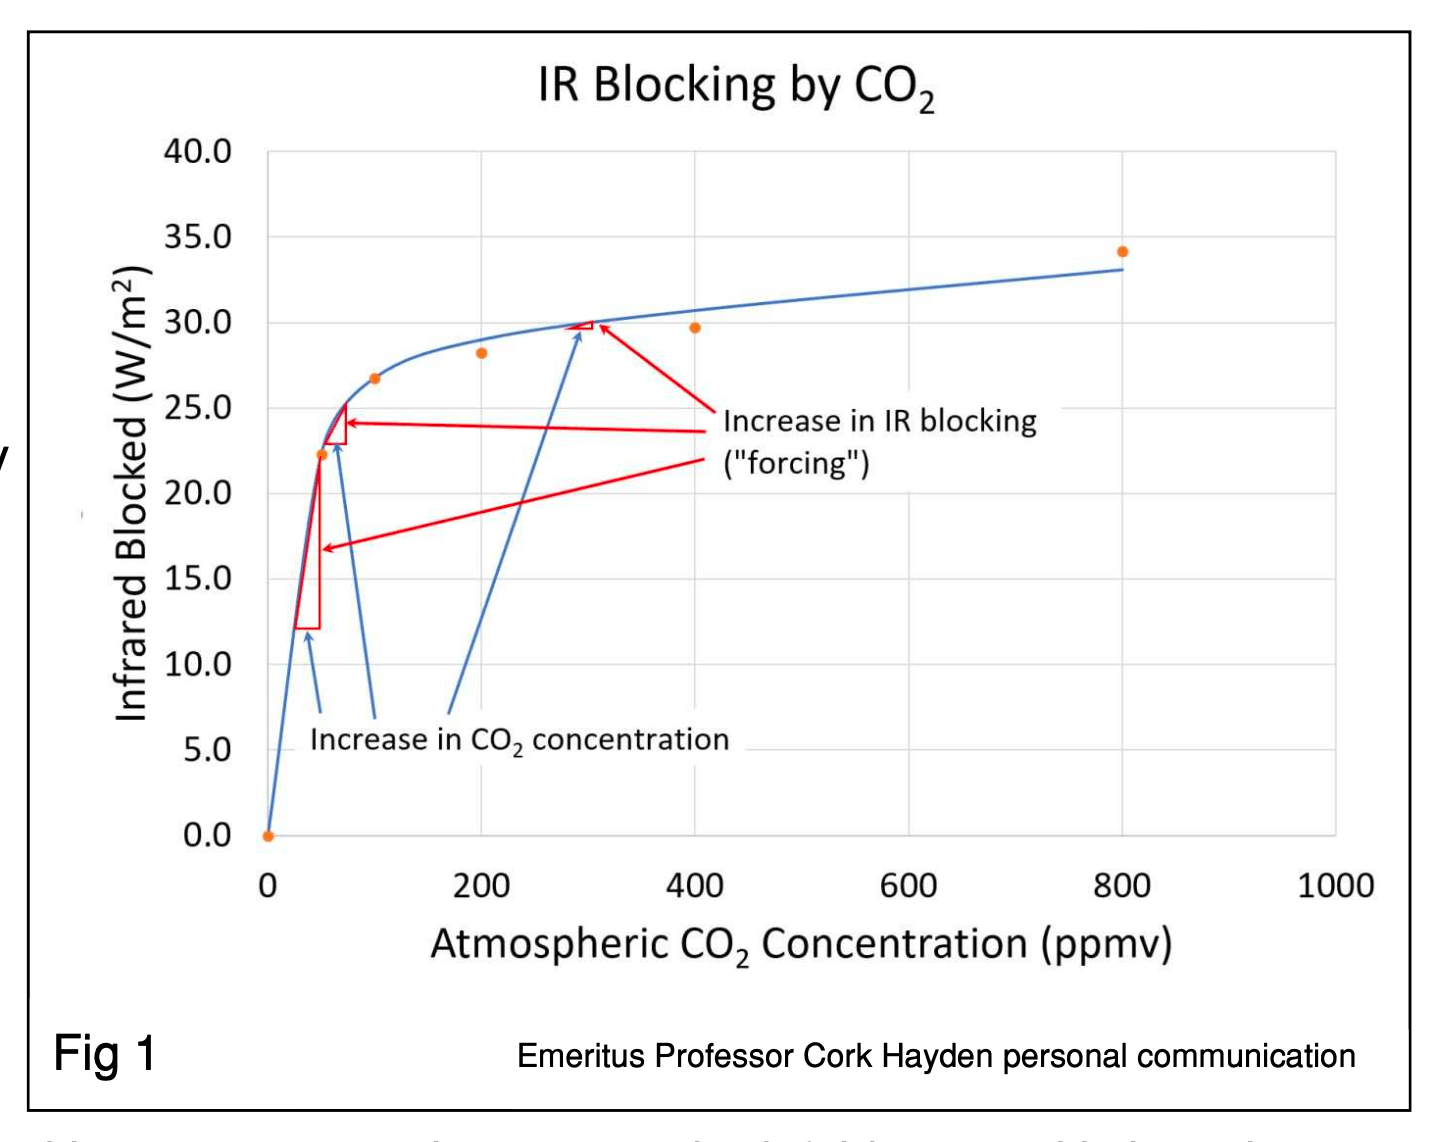
3. To get its GWP the IPCC divided the increased absorption from pulse of methane to the increase from an equivalent pulse of CO2. This is like taking the increase from the left most red triangle (right) (but on a curve for methane) and dividing it by the increase from the right triangle.
The difference is that CO2 is near saturated and the methane is not.
The issue is that the methane curve (calculated from hi trans data) did not include the overlap from water vapour, which absorbs the same wavelengths of infrared. Had the calculation been made on an atmospheric mix then the result would be very different. This is represented in fig 1b (below) with a gas spectrophotometer. the left blue panel is how the IPCC did it and the right panel is how it should have been done.
To gauge the effect of having water vapour present, it is useful to compare the photon path lengths which are based on water being ~15000 ppm and CH4 at 1.8ppm

Photon path length at 7.65μ
Water ~ 4 mm
Methane 250 m
CO2 (at 15μ ) 20 cm
This means that virtually all radiation from the Earth at 7.65μ is absorbed by water within a few centimetres of the surface of the Earth. As methane amounts to only 0.013% of water vapour then its contribution to absorption is of that order.
Doubling methane will only increase its contribution to 0.026 % -- Insignificant.
GWP that ignores the absorption overlap with water it is not scientific, it is dishonest and misleads politicians and the public.
GTP
Like GWP, GTP is based on mass and therefore misrepresents the role of methane by a factor of 2.75. It also depends on model manipulation to arrive a temperature value, this is discussed further on.
Summary.
The claim that methane is 28 times worse than CO2 has been used to brainwash the public and politicians that this is a real problem that has to be dealt with.
No scientist should accept this claim.
While the per molecule forcing of methane is some 30 times that of CO2 the IPCC claim that methane is 28 times worse fails for three reasons;
1. Because that comparison is made in the absence of water vapour. which ignores the overlap in absorption spectra from water vapour.
2. The low concentration of methane means that even though the per molecule forcing is high, the amount of warming caused is minute, simply because there is not enough methane present to have a significant effect.
3. The time scale over which a doubling might occur has been ignored. When the calculated temperature change is spread out over the doubling time, the change on a yearly basis is very very small. e.g. at 0.0076 ppm /year for a methane the doubling time is 250 years.
The role of methane has thus been misrepresented to the public and to politicians and this needs to be corrected.
Corrected for these issues, then the warming effect of methane becomes minuscule.
7 to 8 micron band
Water ~15000 ppm,
Methane 1.9 ppm
Nitrous oxide 0.3 ppm
12 - 20+ micron band
Water ~15000 ppm
Carbon dioxide 420 ppm
fig2
Absorption of infrared at ground level
At ground level (in NZ) the molecules absorbing in the regions either side of the transparent window are shown in fig 2. Radiation in the 8-12 micron region (the window) goes straight to space.
Warming of the atmosphere is caused by GHGs absorbing infrared radiation from the Earth. Of those molecules absorbing in the 7-8 micron range water (at 15000 ppm) constitutes 99.987% and methane at 1.9 ppm 0.013%. If methane is doubled to 3.8ppm (0.025%) then water would constitute 99.975% of the molecules absorbing in the 7-8 micron band.
Given the absorbance of both is of the same order of magnitude then one can conclude that the effect of doubling methane is insignificant. Water absorbs virtually all the radiation from the Earth in the 7-8 micron range within a few centimetres of the surface of the Earth.
The energy once absorbed will be transferred by collision within a billionth of second to other gases, mainly nitrogen and oxygen and the infrared energy radiated will have been converted to kinetic energy. As Temperature is a measure of the average kinetic energy then the absorption of infrared will increase the temperature of the atmosphere by some small amount.
Virtually all energy radiated as infrared (excluding window wavelengths) is absorbed by the atmosphere and transferred to kinetic energy of the atmosphere within a few metres of the surface.
Above The Surface
Greenhouse gases are also re-energised by collision and again, either lose that energy in collision or radiate it away. Excited GHGs retain the energy for about 1 millionth of a second while collisions occur at about a billion/second.
As altitude increases the rate of collisions decreases allowing more, excited GHGs, to radiate and the photon path length increases to the point where some upward directed photons will escape to space.
The molecules radiating to space change with altitude as water is gradually frozen out of the mix (above 8 km on average) leaving CO2 to be the major radiator into the stratosphere.
Methane has little effect as a radiator to space because;
• its concentration is too low
• even into the stratosphere it competes with water vapour which up into the stratosphere remains twice that of methane at 4 ppm (Fig 3)
• Temperature above 8 km is of the order of −50°C. At this temperature the Stefan-Boltzman curve has moved to longer wavelengths and there is very little radiation in the 7-8 micron range from this altitude. (Fig 4)

.
Fig3

Earth’s spectra showing Stefan-
Boltzman curves for 280 K (7°C)
and 220 K (−53 °C).
Note that there is very little radiation in the 7-8μ micron (1250 -1420 wave numbers/cm) region at 220K
The 7-8 radiation above the 220K line has come from lower altitudes, mainly from water vapour. Fig4
Emissions Height
This is the altitude that radiation to space starts. That altitude varies with the GHG involved.
For CO2 at 420 ppm the emissions altitude is in the stratosphere.
For water (on average) is about 7-9 km, the altitude where its concentration decreases to a point where photons can escape to space as opposed to being absorbed by other water molecules..
David Frame: Contends that warming is determined by the emissions height and therefore any increase in concentration will increase the emissions height and therefore increase warming. The doubling of methane he contends will therefore raise the emissions height and cause warming.
Given that water vapour varies over a range of 50,000 ppm to 5000 ppm, and that this variation can occur over short distances and time spans makes a mockery of that claim. An increase of 1.9 ppm in an absorbing gas is insignificant compared to the range of water and changes in water vapour that happen on minutes to hours every day.
The examples below all produce an increase in water vapour greater than 80 ppm;
• 0.56 °C temperature increase within the daily temperature range and with Relative Humidity held constant at 65%. Such atmospheric changes easily occur in less than 1 hour.
• ONLY a 2% INCREASE in Relative Humidity from 65% to 67%: NO temperature change:Results presented at base-level temperatures from 6.5 °C to 25 °C. Change easily occur in 1 hour..
• ONLY a 1% INCREASE in Relative Humidity from 70% to 71%: NO temperature change: Results presented at base-level temperatures from 18 °C to 25 °C. Changes easily occur within an hour.
80 ppm is greater than the rise in CO2 over 43 years.
Methane pails to insignificance
Data from Emeritus Professor Geoff Duffy Auckland University (including diagram below)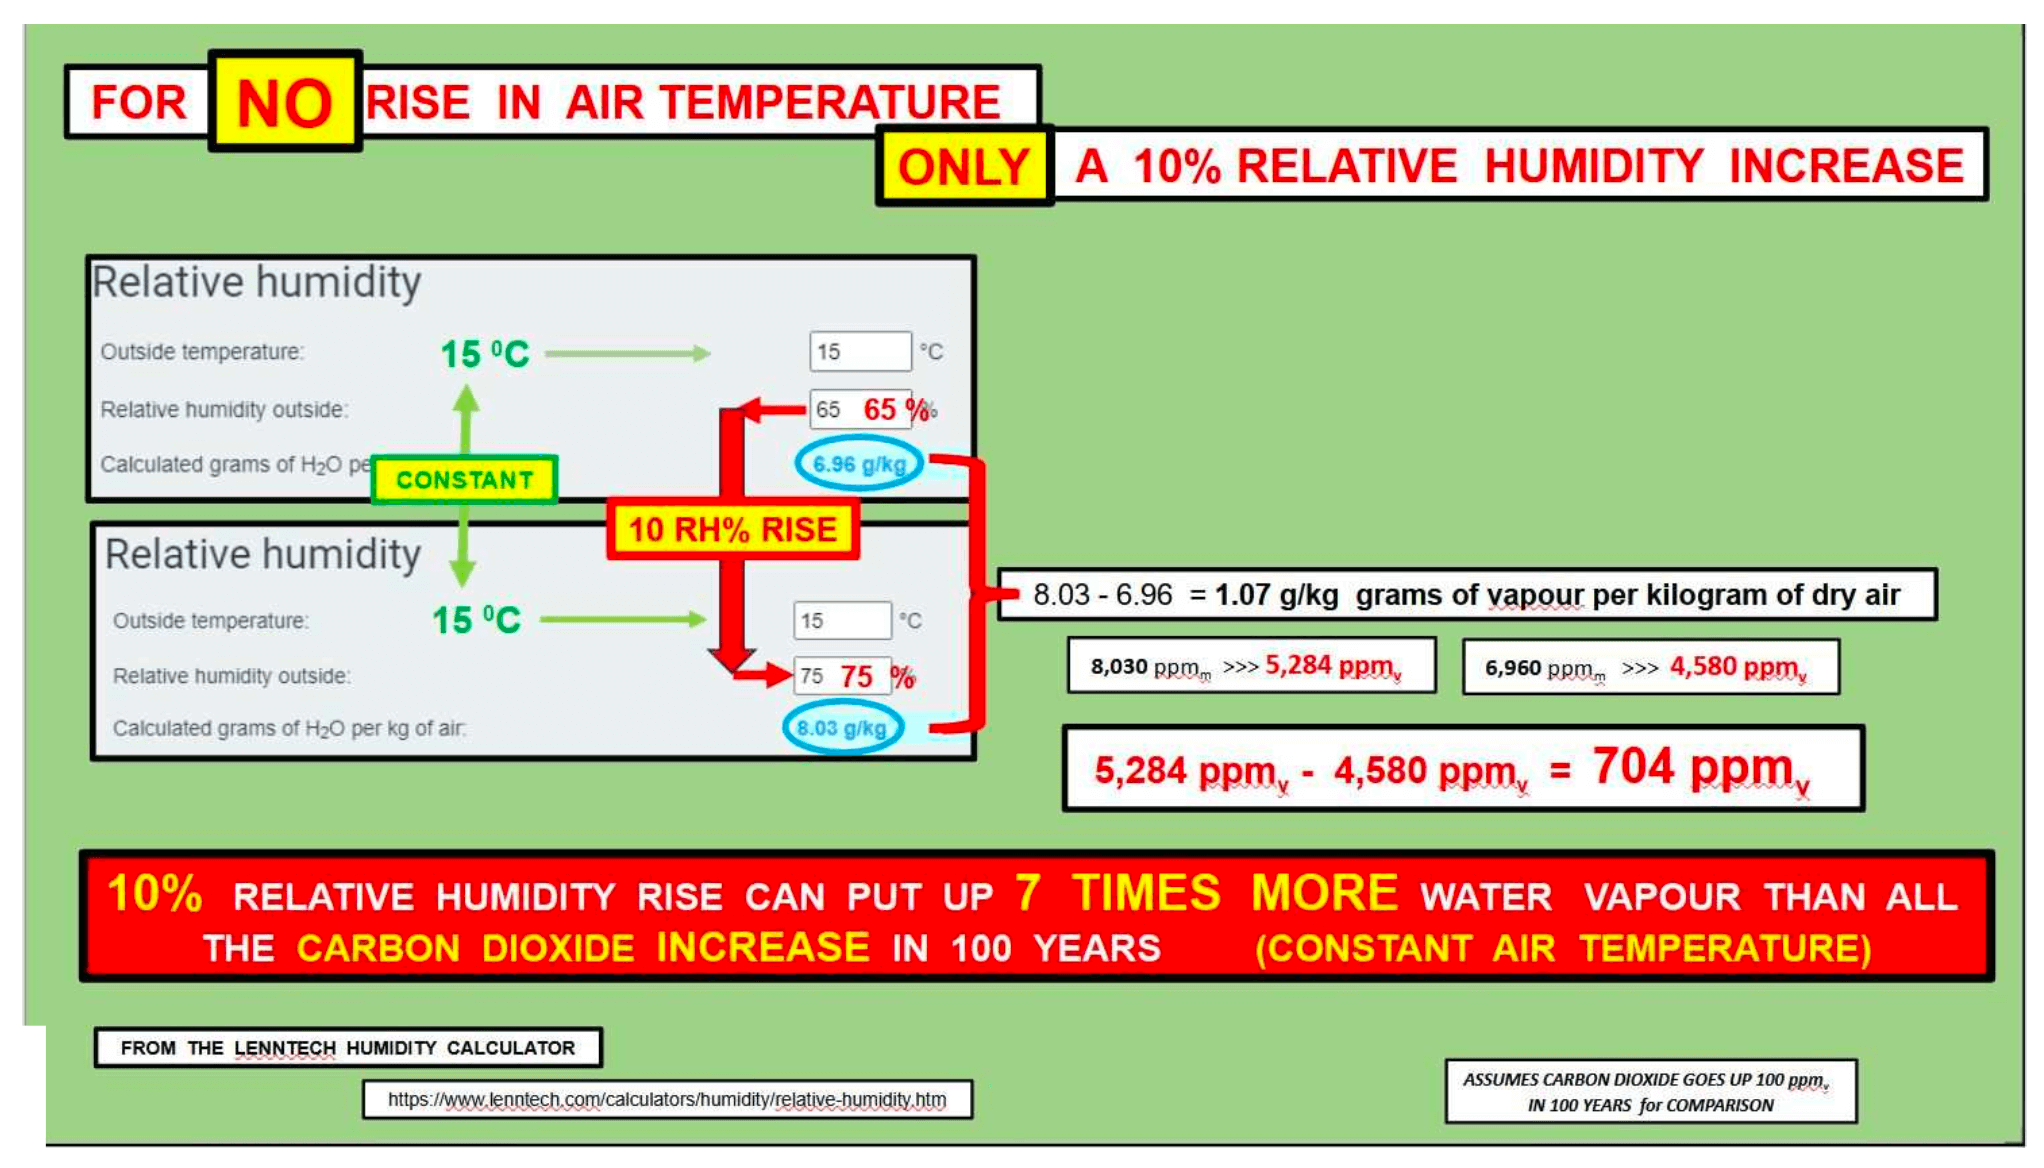
Fig 5
Forcings
At right are the column densities of gases. While water is far more concentrated at the bottom of the column its total density is still a 1000 fold greater than methane.
In the chart below, the per molecule forcings at the optically thin limit (column 1 (z)) show that water is 3 times better and CO2 5 times better at absorbing radiation than methane.
In the second column (z,0) water is ~5 times better and CO2 ~10 times better at absorbing radiation.
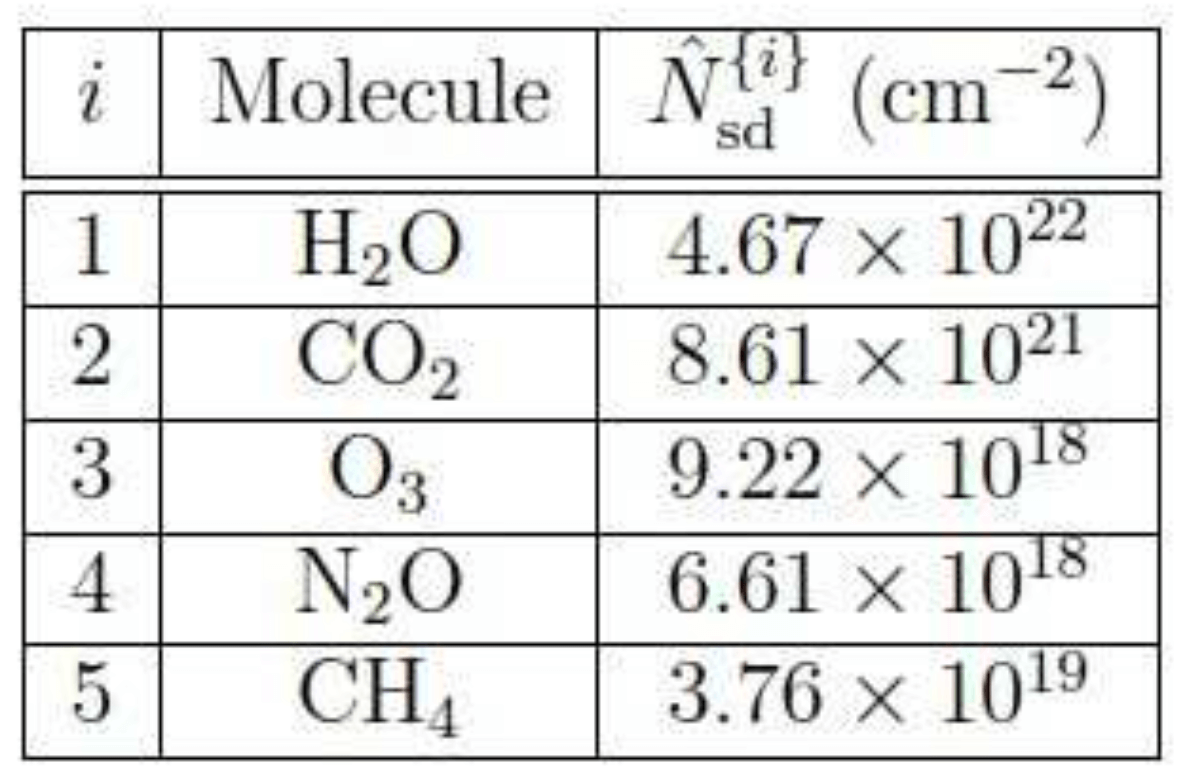
Wijngaarden & Happer 2020
Fig 6

Fig 7, Wijngaarden & Happer 2020
In the third column is the effect of adding one molecule to the existing atmosphere. In this case water is 100 fold less than methane because water is saturated, however the effect of methane is still insignificant.
This is shown graphically in the following chart where the;
Blue lines represent the optically thin limit (column 1)
Green lines represent adding one molecule where previously there were none
Red line is the effect of adding a molecule to a mix where all gases are in their standard densities
The suppression of red lines for water and CO2 show the extend of saturation. This data shows that the forcing from an additional water molecule is suppressed by four orders of magnitude.
The suppression of forcing from methane in the presence of water is clear.
The IPCC uses the blue line when it should use the red line to compare the effect of methane in the presence of water.

Fig 8, Wijngaarden & Happer 2020
The effect of doubling methane is the difference between the black line and the red line (below).

Fig 9

Fig 10
An enlarged view of the effect of doubling CH4. It can be seen that the doubled line (red) is almost indistinguishable from the black line (present concentration.
Below - An enlargement of these forcings in milliWatts methane in black dashes.
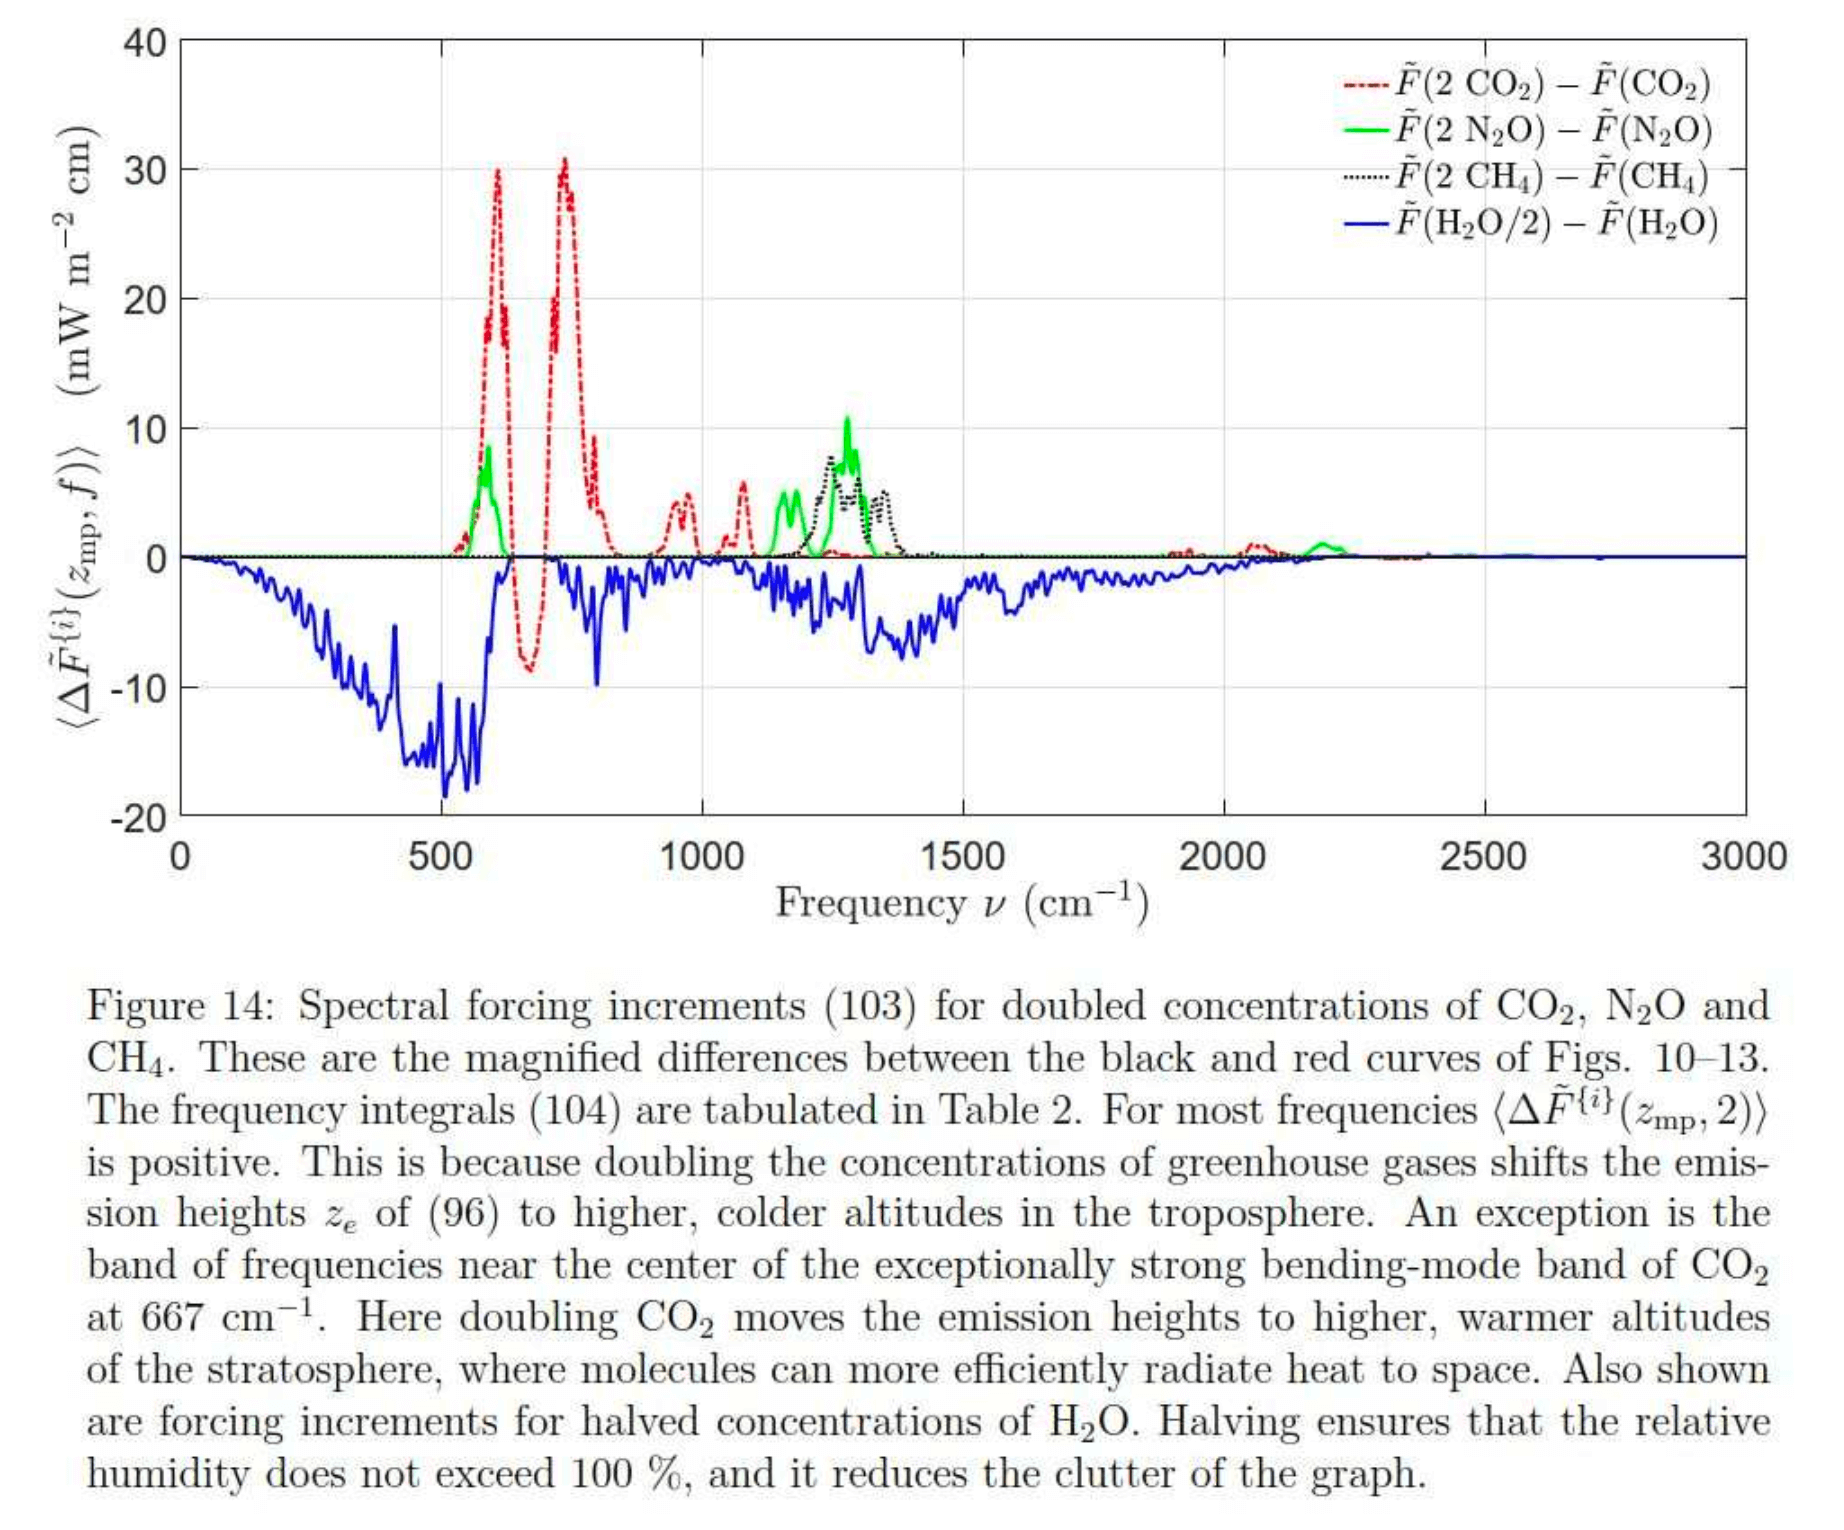
Fig 11, Wijngaarden & Happer 2020
Converting Forcing To Temperature.
Will Happer commented that the forcings were easy to calculate but that the mischief starts with converting the forcings to temperature.
In our discussions with David Frame he made the following point regarding the W&H paper:
Happer and Van Wijngaarden claim “Methane concentrations may never double, but if they do, WH[1] show that this would only increase the forcing by 0.8 W m-2.”
The equation in Box 7.1 of the WGI report from IPCC AR6 relates top of atmosphere radiative imbalance, ΔN, to radiative forcing, F, and surface temperature, ΔT, via =α, the feedback parameter.
ΔN = F + α ΔT
In equilibrium, ΔN = 0, so we can rearrange the equation to F = -α ΔT.
Taking Happer and van Wijngaarden’s estimate of F.CH4 = 0.8Wm -2 alongside the feedback parameter estimate from later in Chapter 7 (p978) of α = -1.16 Wm -2, this gives ΔT= 0.69°C.
In other words, taking Happer and van Wijngaarden’s forcing estimate for a doubling of methane at face value, we get an equilibrium surface warming in response of 0.69°C. This makes it the second most important anthropogenic greenhouse gas, behind CO2; which is what the mainstream science community has said all along.
In still other words, far from showing methane’s irrelevance, Happer and van Wijngaarden have simply underscored its relevance. That’s what their numbers actually show.
There is a serious problem here. The derived equation from the IPCC F = -α ΔT. is wrong
It rearranges to ΔT = F/α Forcing divided by the feedback factor alpha.
This means that if the researcher chooses a lower value for feedback then the temperature change gets larger. Many researchers consider the feedback to be near zero or negative. As feedback approaches zero this equation would return temperatures approaching infinity i.e. reduce the feedback and the world becomes a ball of plasma - what nonsense.
Feedback is mainly due to the theoretical increase in water vapour, a larger feedback value should result in a higher temperature. The IPCC equation does the opposite.
This equation dT=α’dF change in T = feedback x change in forcing.
This is the inverse of that used by the IPCC and gives the correct relationship between feedback, forcing and temperature. So an increase in feedback increases forcing as would be expected.
The derivation of this equation dT=α’dF is in appendix 1
To get a temperature we need to solve the equation Z= ε σ I T4 = 277 W m -2
Emissivity from doubling CO2 dε/ε = - 1.1%.
Solving for dT = - (1/4)(dε/ε) T. with T at 290K
gives a temperature increase from doubling CO2 of dT = -(1/4)(- 1.1%)290 K = 0.8 K
herefore the temperature change = 0.8 °C. for doubling CO2.
Putting this in IPCC speak.
α = dT/dF = T/(4εα T4) = 290 K/(4 x 277 Wm-2) = 0.26 C m2W -1
So a forcing of dF = 3 W m-2 from doubling CO2 should cause a temperature increase of
dT= α•dF = 0.8 °C,
Doubling methane has no more than ¼ of the forcing from doubling CO2 and would take centuries to happen. But it would increase the temperature by
dT = 0.2 C for doubling CH4.
The much larger temperature increases quoted by the IPCC and its acolytes assume huge positive feedback, supposedly from water vapour and clouds. Most net feedbacks in nature are negative, not positive. So the actual warming from doubling CO2 or CH4 will probably be less, not larger than the feedback-free estimates of 0.8 °C and 0.2 °C above.
At the present rate of increase, doubling will take 250 years, therefore warming from methane would be of the order of 0.0008 °C/year.
0.0008°C / year
Insignificant, inconsequential unmeasurable
Feed Back
Many scientists consider the feedback values used by the IPCC are extreme Ollila, Lindzen, Happer etc.
That feedback, is based on the theory that a warming atmosphere will allow more water vapour as per the Clausius-
Clapeyron Equation. More water vapour = more forcing = more warming
The feedback used by IPCC aligned scientists ignores the reality of actual data.

.
.
.
.
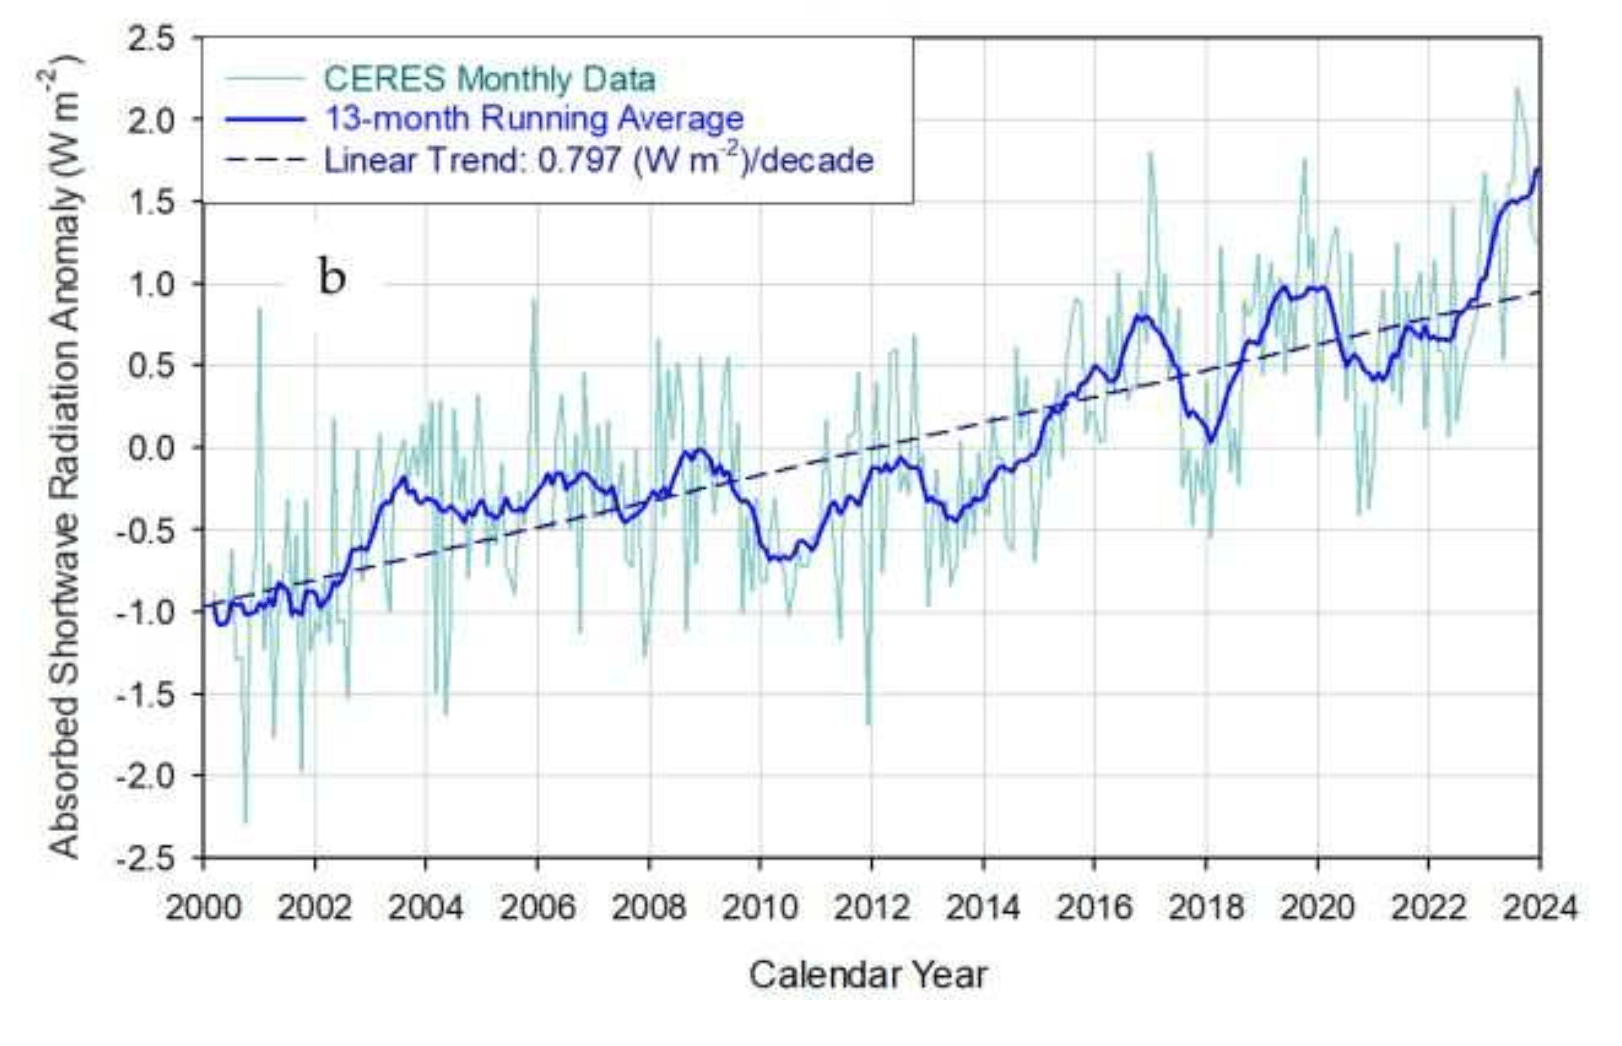
Earth has warmed because albedo has decreased allowing increased absorption of short wave infrared from the sun, (see
graph to right) An increase in outgoing longwave infrared has also been observed which would be expected with the increased
warmth. The graph of specific humidity (below) clearly shows that water vapour in the upper troposphere has been declining for
over 70 years, only surface level specific humidity has increased (ever so slightly).
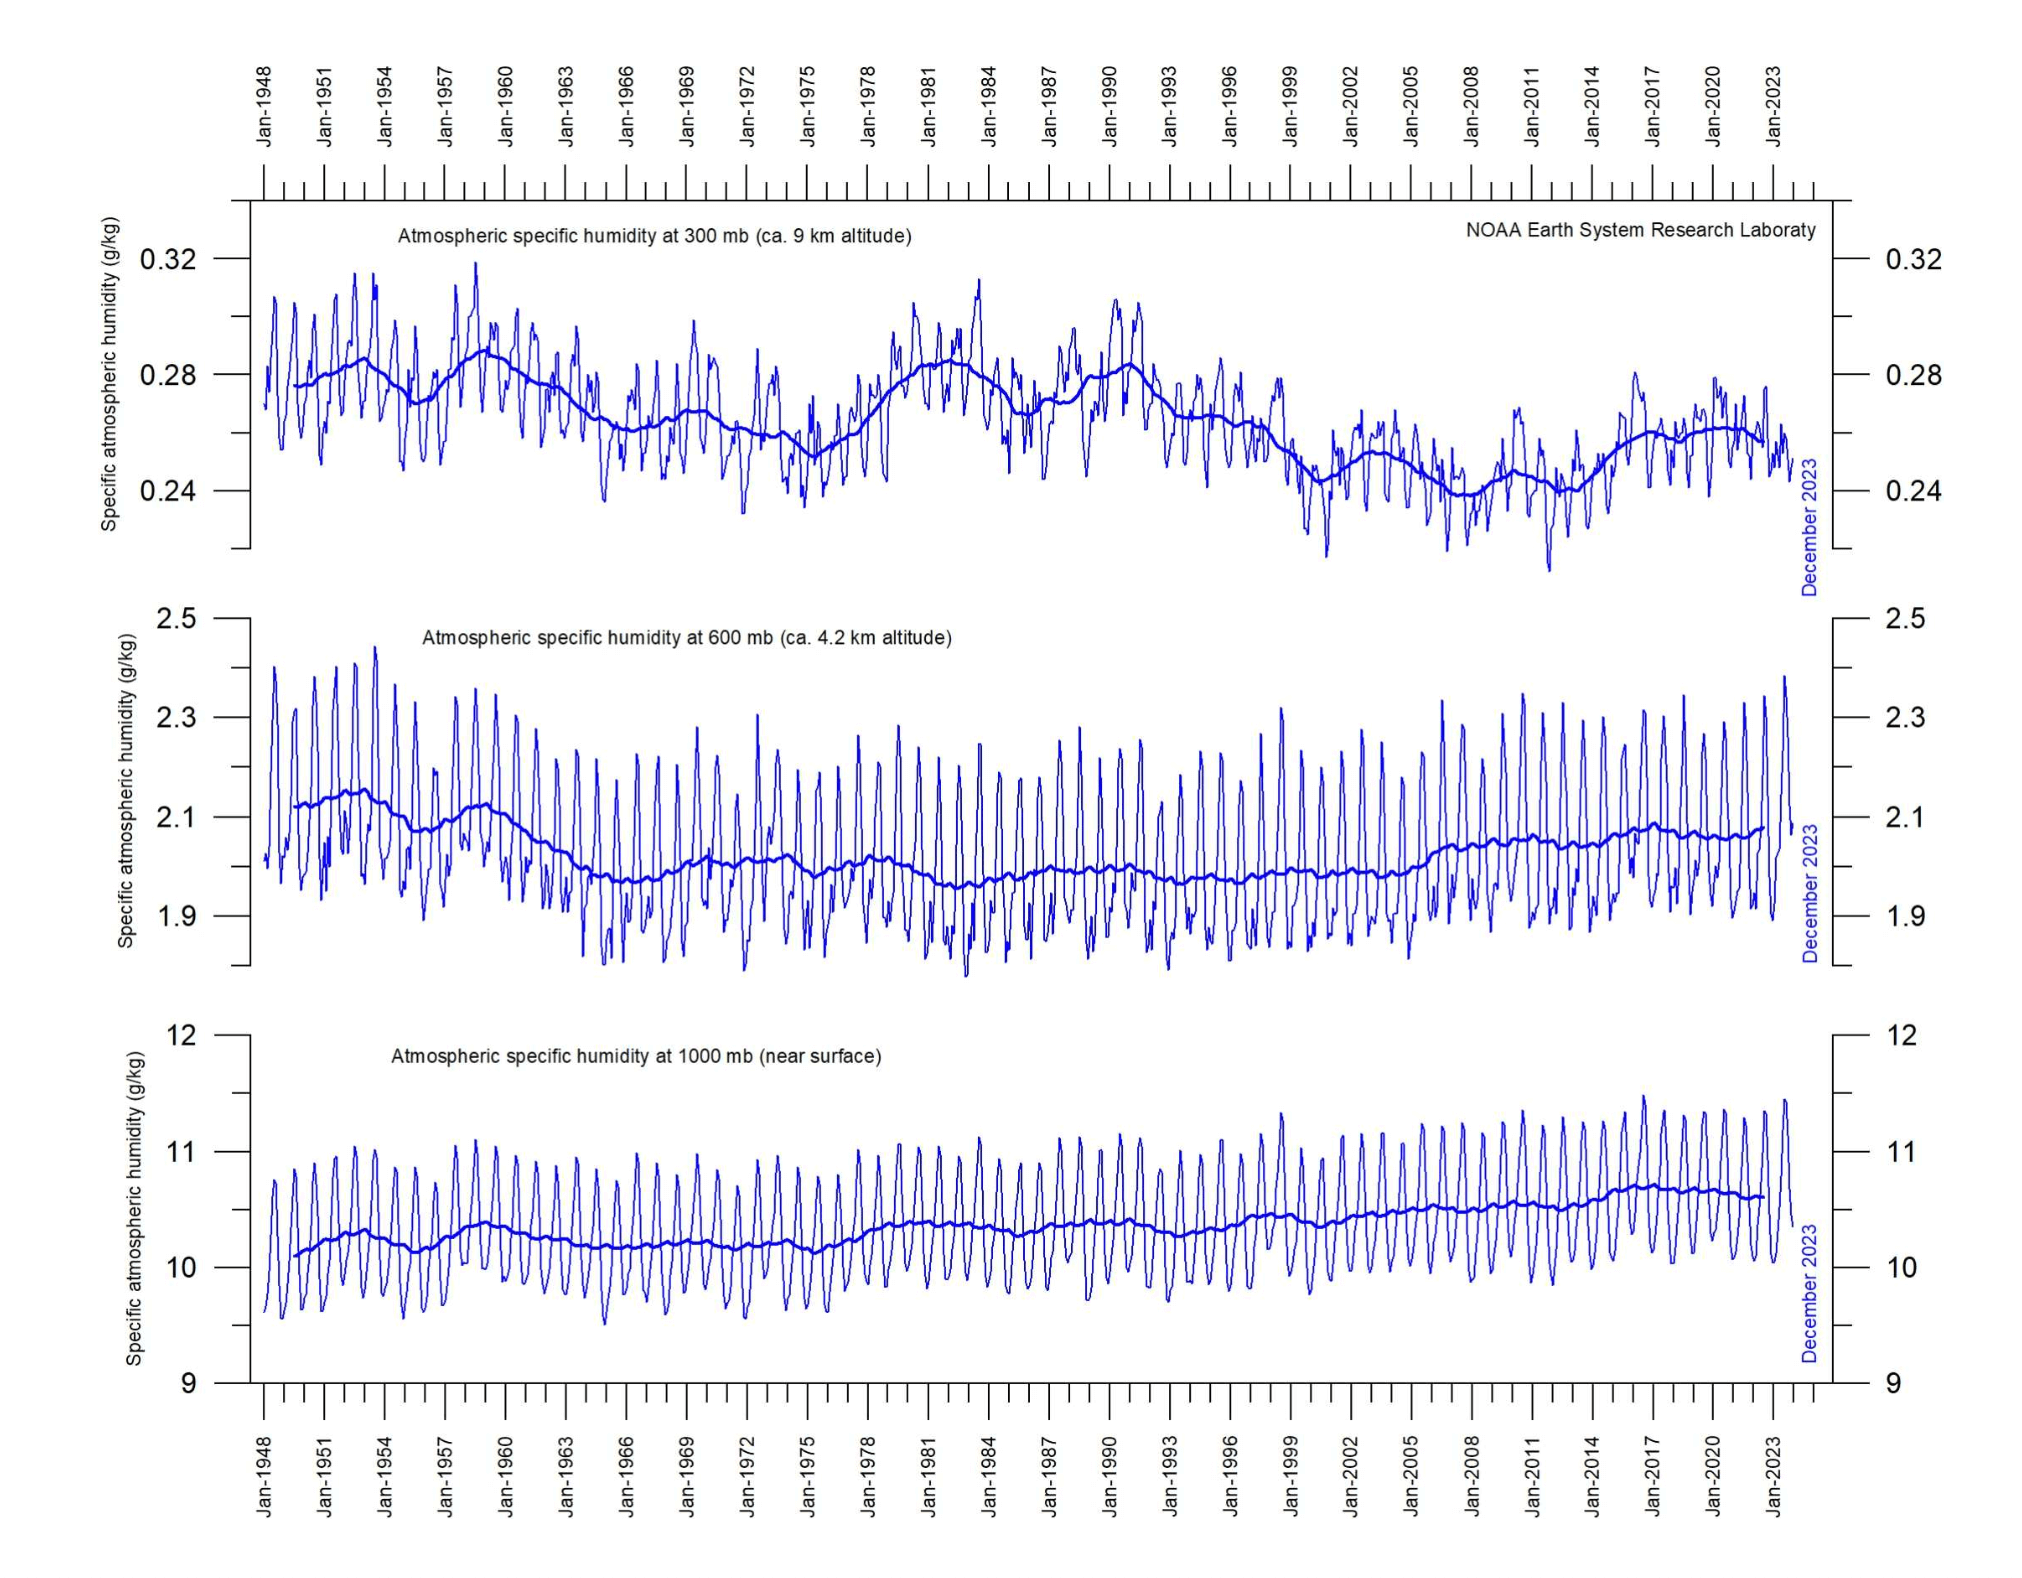
This is not what the models predict. The scientific method requires that if a hypothesis is not supported by observation /experiment then it is wrong. Richard Feynman. The feedback from water vapour has not increased, in the all important upper troposphere it has decreased. Therefore the magnitude of the feedback used by the IPCC is WRONG.
The Nazis challenged Einstein saying ‘there are a 100 scientists who say you are wrong’. Einstein responded, ‘Why 100, it only take one to prove me wrong’. A lesson the climate fraternity has yet to learn.
With GWP, feedback, and effect of water vapour overlapping methane, the IPCC is travelling a path that is not supported by observations.
Genuine scientists would seek to correct this situation.
In addition, Cork Hayden has pointed out that if the Earth warmed 3°C (average from IPCC models), then the Earth would radiate an additional 16.7 Wm−2 Of which, CO2 if doubled, would absorb only 3 - 3.7 Wm−2 So what happens to the other ~13 Wm−2 ? the Earth cools ? until it returns to the temperature that matches the 3.7 Wm−2 i.e. 0.65°C
Climate Models
The IPCC (AR6 report) has concluded that a signal of climate change has not yet emerged beyond natural variability for the following phenomena: It then lists almost every form of extreme weather.
So there is no climate emergency
The report also makes it clear that for a great portion of the planet, a detectable change in the rate of relative sea level rise (RSLR) hasn’t been found (and might not even emerge before 2100),
So the sea will not rise up and flood the land in the next few decades.
Both of these statements contradict the fairy tales of an imminent global catastrophe.
So where does “ the Earth is boiling” and “the oceans overflowing” come from, along with eating meat is bad for the planet.
Answer - the climate models
The general circulation models that produce all sorts of forecasts for the next 100 years are quite incapable of forecasting anything. They are research tools that at this stage are not fit for purpose.
The IPCC in AR5 said that it knew neither the sign nor the magnitude of the effect of warming on low cloud.
Low cloud is one of the most important parameters because it reflects sunlight and shades the Earth All models have to input a value for what low cloud will do with warming, but that value is unknown and therefore a guess. But that is not all, a recent review by Roy Clark [16] makes devastating reading as it highlights the huge range of inbuilt errors in the climate models.
It becomes clear that no paper that uses these models, such as Allen et al, [21] is worth a damn. The approximation they have to warming is simply obtained by fiddling the figures until you get something that fits your expectations. (Koonin Unsettled)
The models cannot work backwards and reproduce past climate change. Therefore they fail the validation test that all good scientific models achieve.
Overall the models produce too much heating.
As I have shown the models use a derived value for water vapour in the upper troposphere that totally ignores the actual values that have been around for decades. As a consequence the IPCC feedback is far too large.
Most feedbacks in nature are negative.
Life Time Of Greenhouse Gases
The IPCC has used the longevity of GHGs as a way of explaining how such a small proportion of a GHG such as CO2 can have any long term effect on the level that GHG in the atmosphere. For example, if CO2 lasted only 4 or 5 years it would be impossible to blame the 3% contribution of humans for the increase that has occurred. Consequently the Bern model was developed to make out that CO2 lasted thousands of years, hence any human addition would last and accumulate.

This has been debunked in many papers, most estimatethe longevity of CO2 to be in the order of 5 to 10 years. eg Frank [11], Koutsoyiannis [12] Berry [24]
.
However, longevity is a false argument.
Consider lake Benmore on the Waitaki River. The lake level is determined by two factors and only two; The inflow and the outflow. If inflow >outflow then the lake level will rise. If outflow > inflow then the lake level will fall.
How long an individual molecule lasts in the lake is irrelevant.
My background is in biochemistry where everything is in steady state. Equilibrium = death. But no one cares how long an individual molecule lasts. The concentration of a substance is only dependent on rates of formation and rates of removal and those depend on concentrations of substrates and products. The longevity of an individual molecule is irrelevant. So it should be with climate.
There is one more important parameter. Providing lake control measures are not used then as inflow increases so outflow also increases. The lake level rises or falls because of a lag between the two. The same is true for both methane and CO2
For methane, when the lake level rises so do the outflows of
• atmospheric oxidation of methane to CO2 and water. [18][21][22]
• oxidation by methanotrophs in soil. [9]
• oxidation by methanotrophs in water [20].
While the atmospheric oxidation is a complex reaction involving many stages, the reactants (apart from CH4) are in plentiful supply so the limiting factor for the reaction is the concentration of methane. The reaction rate is therefore dependant on [CH4] concentration.
The radiative effect of a GHG is instantaneous, double CO2 tonight and tomorrow the world will be half a degree warmer including any feedback effects from water vapour. AGW proponents will say but it take time to heat the ocean. GHG’s cannot heat the ocean. penetration too little (0.01mm).

Path length limits effective radiation to a few centimetres only and for every molecule radiating into the ocean there are 85000 radiating out. [14]
To attempt to calculate the effect a pulse of GHG today will have in 20 or 50 or 100 years time is pure nonsense. Humans have no control over most methane emissions. Ruminants including wild ones are 14% of which NZ agriculture is about 1% Therefore as a source farmed animals in NZ constitute 0.14%. Tinkering on the fringes of that will make no difference at all in the big picture.
The graph of world methane is not linear, the ten year pause from 1998 coincided with the temperature pause - are they related ? The data also shows annual variation of about 25 ppm - certainly not caused by NZ livestock. Natural events can swamp any human influence. For example the present warmth is almost certainly due to the Hunga tonga Haiipai volcano that put millions of tonnes of water into the stratosphere.
Future Projections Of Methane
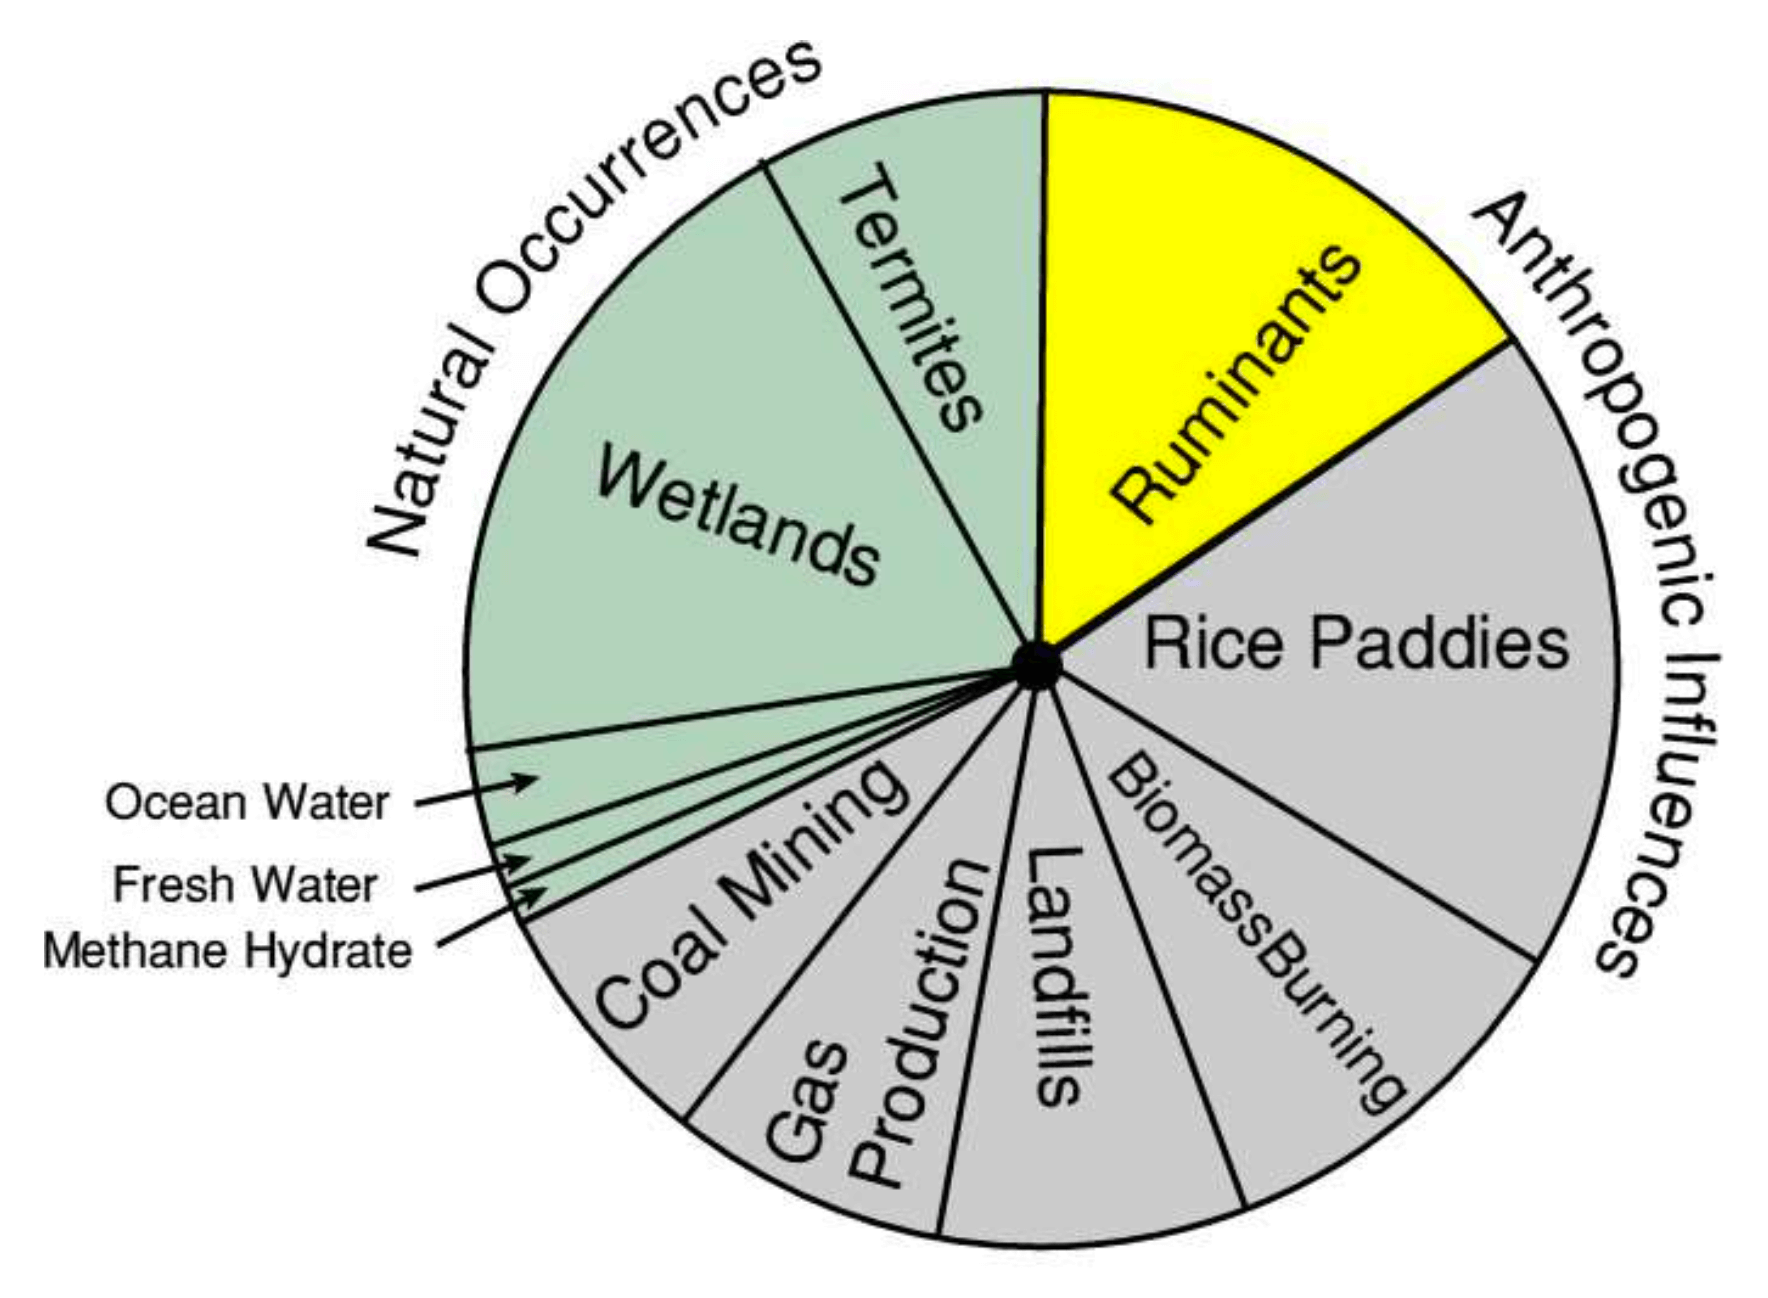
The chart gives the rough proportions of
METHANE sources
.
At present there are some 75 million wild ruminants and 3.5 billion farmed animals. However, 10,000 years ago the proportions were very different with wild animals vastly outnumbering domesticated animals, a time when millions of caribou and bison roamed North America.
The point being that animals, as a source of methane existed long before humans domesticated them. While they are more intensively farmed today, there are also millions of hectares where grazing animals have been excluded for crops etc. In that sense their contribution to global methane is probably little different from pre human times. So are they really an anthropogenic factor ? 20,000 years ago the worlds grassland would have all been grazed by ruminants. How many of them were there then ?
We know that there was a very severe decline in megafauna (animals over 45 kg) in the early holocene attributed to humans. Actual numbers are difficult to quantify but our understanding of biology would suggest that all eco niches were well populated and governed by the age old relationship between predators, prey and the availability of grass.
The assumption that you can calculate future methane from todays livestock is farcical.
• The reason for the pause 1998 to 2008 is unknown.
• Biomass burning emissions of methane decreased by 3.7 (±1.4) Tg CH4 per year from the 2001–2007 to the 2008–2014 time periods using satellite measurements of CO and CH4, nearly twice the decrease expected from prior estimates.
Reason unknown. They go onto say; However, determining the relative contributions of anthropogenic, biogeochemical, and chemical drivers of methane trends has been extremely challenging and consequently there is effectively no confidence in projections of future atmospheric methane concentrations. [26]
• A decade-long dataset (2010–2019) of satellite observations of methane showed that tropical terrestrial emissions (rainforests) could explain more than 80% of the observed changes in the global atmospheric methane growth rate over this period [27] (not farmed ruminants)
• The amount of methane from clathrates may change drastically due to plate tectonics or submarine volcanic activity or deep sea methane gas seepage (e.g. off NZ coast above Hikorangi trench and volcanic activity in Tonga Kermadec region)
• Remove farmed ruminants and rotting grass will replace the methane from animals.
• Stop making landfills for rubbish and world methane will drop.
• Will Asia stop planting rice, no it will most likely increase to meet the needs of their population, with a concurrent increase in methane.
Warming Effect Of Radiation Due To Methane
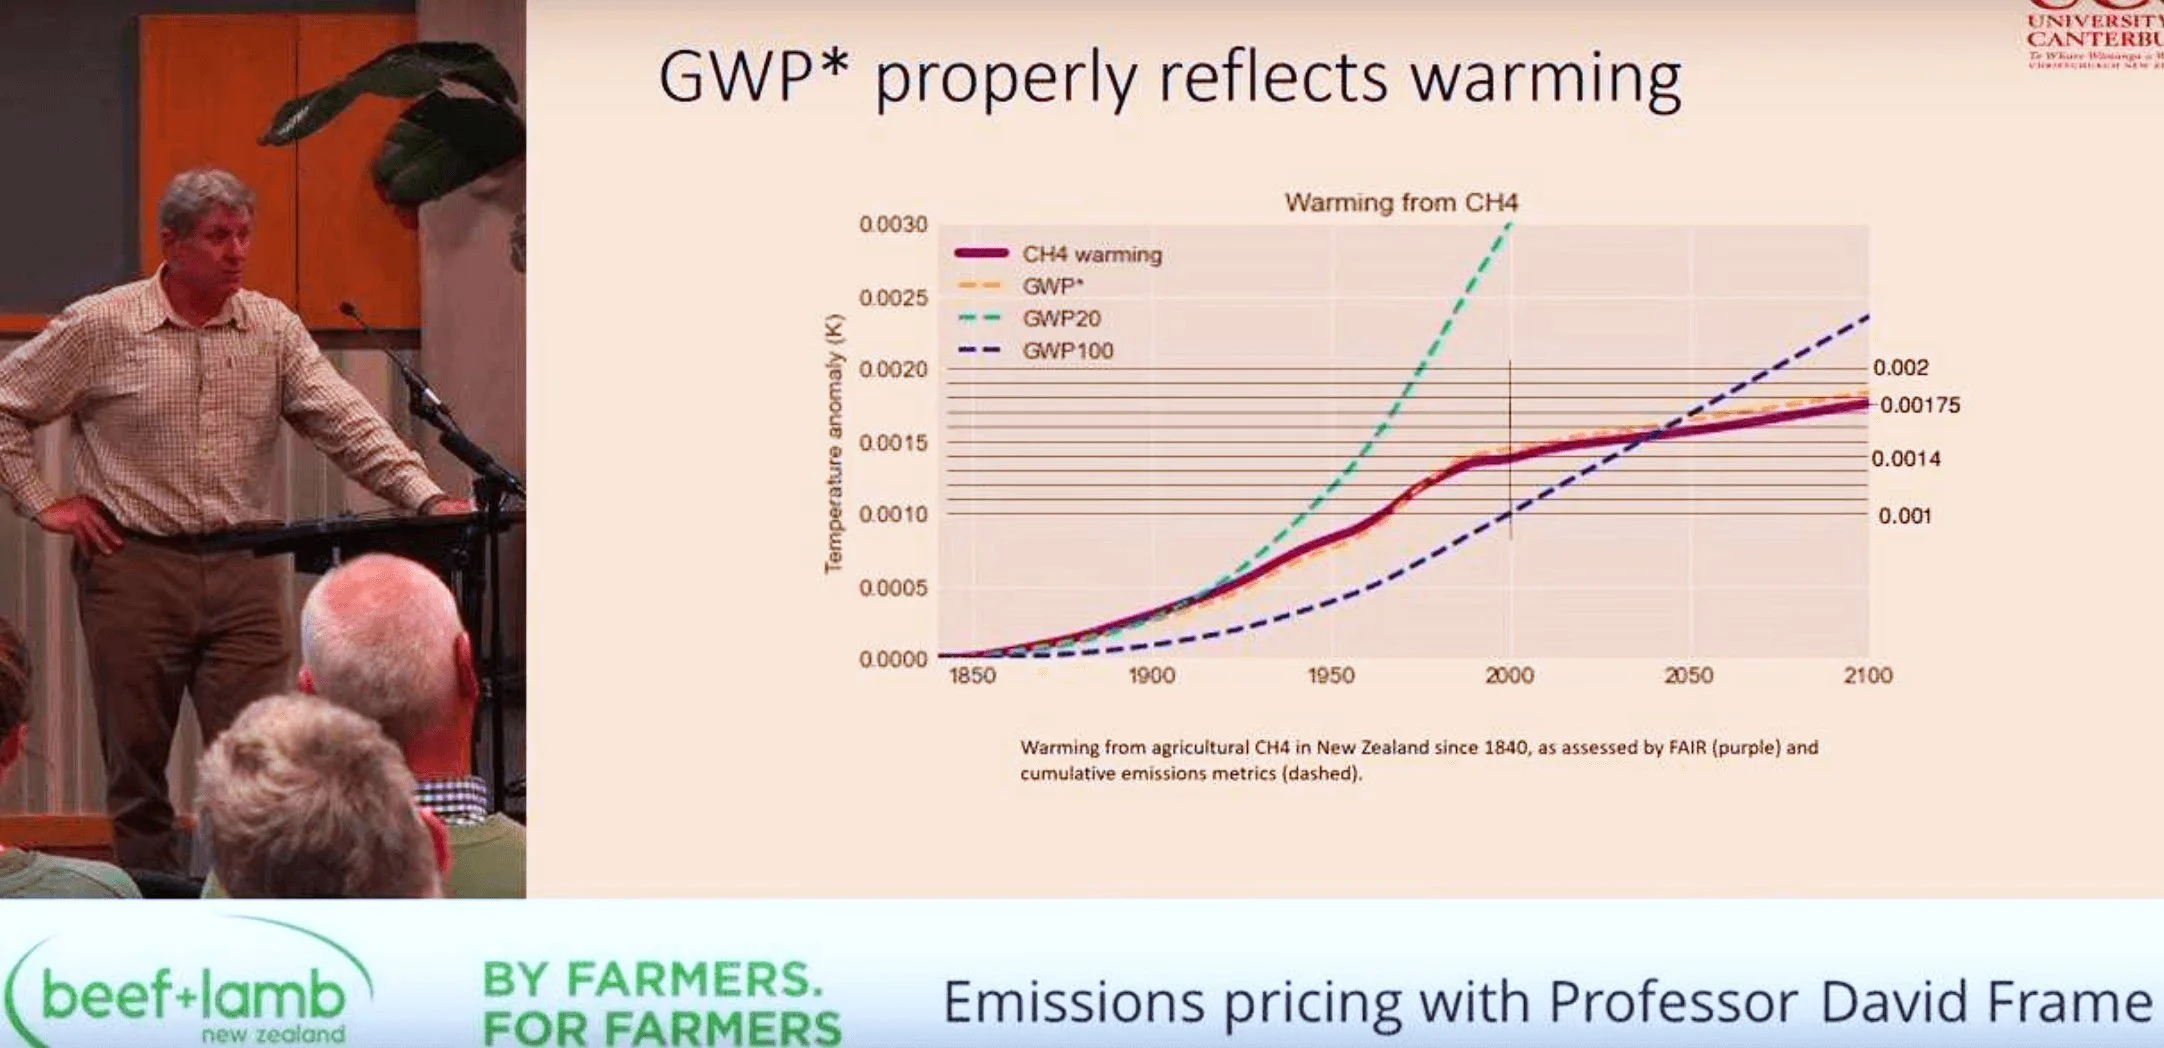
David Frame: Presented this graph to a meeting of farmers at Invercargill
It shows the warming caused by NZ livestock from 1850 until the present and then projected to 2100.
By his calculation the warming from 1850 to 2000 was 0.0014 °C. The graph was intended to show how GWP* better fits the data than the other GWP options. What it actually shows is how minuscule the warming from NZ livestock actually is, even by the inflated values David was using.
His projected warming from 2000 to 2100 of 0.0004 °C epitomises the stupidity of this whole exercise.
0.0004 °C over 100 years is 4 millionths of a degree per year.
This is insignificant, inconsequential it is not measurable, either on a country wide basis, let alone an individual farm basis. China emits more CO2 in one day than NZ does in one year. their annual increase is greater that NZ’s annual contribution and NZ is getting excited about this minuscule contribution from farming.
Given that Earth is still in an ice age (which account for only 20% of the last 600 million years) and that normal temperatures were 10°C or higher, being worried about 0.0004°C is ridiculous.
William van Wijngaarden in his contribution to the panel on the role of NZ agriculture says that if we slaughtered every ruminant animal in NZ it would only avert a temperature rise of 3 to 6 millionths of a degree per year. which is in accord with David Frames estimate.
Insignificant, inconsequential, unmeasurable
David Coe Et Al [6]
From this data (in his paper) it is concluded that H2O is responsible for 29.4K of the 33K warming (89%), with CO2 contributing 3.3K (10%) and CH4 and N2O combined just 0.3K (0.9%). Climate sensitivity to future increases in CO2 concentration is calculated to be 0.50K, including the positive feedback effects of H2O, while climate sensitivities to CH4 and N2O are almost undetectable at 0.06K and 0.08K respectively. This result strongly suggests that increasing levels of CO2 will not lead to significant changes in earth temperature and that increases in CH4 and N2O will have very little discernible impact.
Herman Harde [7]
5.4. Absorption of Terrestrial Radiation. The dominant influence of water vapour on the radiation and energy budget in the atmosphere can also be deduced from an analysis of pure absorption spectra. So, under conditions as discussed before with an average global water vapour content of 1.46% at the surface and a temperature of 288 K, the overall absorption of the terrestrial radiation, only caused by water vapour, is already 77.7%. Together with methane and ozone in the atmosphere-sphere, the absorption increases to 80.7%. On the other hand, CO2 alone at a concentration of 380ppm would contribute to 24.1%, but in the presence of other gases, its influence is repelled to 4.6%, which is due to the strong spectral overlap with the other components, particularly with water vapour, and the total absorption only climbs up to 85.3%.
Peer review in climate science
Since the mid 90’s the climate alarm fraternity has put huge pressure on science journals to not publish papers that opposed the IPCC view of the world. In the late naughties I was aware of 4 journal editors who were removed for publishing such papers. The tactic was to write to the Journal editors and boards threatening to boycott that journal if such an such a paper was not retracted. This practice was still in operation last year with a paper that appeared in Springer publications. The Board capitulated and withdrew the paper.
The leaders of this anti-science movement are all top players in the IPCC. Phil Jones, Keith Briffa, Jonathon Overpeck, Michael Mann, Tom Wrigley, Jim Salinger, Kevin Trenberth and a few others, whose dirty deed were available for all to see in the climategate email release 2009.
The effect of this pressure was to make journal editors very cautious about printing anything that challenged the IPCC view. Recently the UNFCCC came to an agreement with Google that on any search to to with climate, only IPCC references would appear. As the head of the UNFCCC said “we own the science”. Any self respecting scientist would gag over that statement.
For this reason many papers that challenge the IPCC world view are forced to publish in the lesser journals. That does not detract from the content or implications of the research. e.g. references [1] & [2]
“Will Happer commented:As for peer review, it has become a joke in many fields of science. Climate is one of the worst. Have Frame point out one thing in the work that Wijngaarden and I have done that is not solid physics. None of the many peer reviewers could point out any problems, but demanded that our papers be rejected because they might cast doubt on the religious cult that is masquerading as climate science.”
So when I read that the panel was trolling through the literature and discarding papers on the basis of their perception of the journal quality or on whether it has been peer reviewed on not, then the exercise becomes one of actively selecting against any paper that does not support the group think or beliefs of the panel members.
Your Report
• Must address the bad science that underlies the GWP. Using spectral analyses that excludes the overlapping absorption by water vapour is not acceptable.
• It must accept that absorption of infrared from Earth in the 7-8 micron band is dominated by water.
• It must highlight the insignificance of the temperature increases from NZ livestock Dave, Will Happer has put out a challenge to you - point out one thing in the W&H paper that is not solid physics.
If you cannot do that then you have a moral and scientific obligation to accept the paper and the fact that methane is irrelevant as a GHG.
References
[1] [2] [3] [4] [5] [6] [7] [8] [9] Allison-Sheahen New Zealand Institute of Primary Industry Management Incorporated The Journal Vol 22 No 3
September 2018 ISSN 2463-3011
Wijngaarden & Happer arXiv:2006.03098v1 [physics.ao-ph] 4 Jun 2020
Dependence of Earth’s Thermal Radiation on Five Most Abundant Greenhouse Gases
Ollila, A. (2012). The Roles of Greenhouse Gases in Global Warming. Energy & Environment.
Lindzen, R. (1994). Climate Dynamics and Global Change. Annual Review of Fluid Mechanics. Still relevant comments on feedbacks
The State of the Climate 2023, Ole Humlum Report 61, The Global Warming Policy Foundation © Copyright 2024,
The Global Warming Policy Foundation. Available on climate4you.com annual report 2023
David Coe, Walter Fabinski, Gerhard Wiegleb. The Impact of CO2, H2O and Other “Greenhouse Gases” on Equilibrium Earth Temperatures. International Journal of Atmospheric and Oceanic Sciences. Vol. 5, No. 2, 2021, pp. 29-40. doi: 10.11648/j.ijaos.20210502.12
Herman Harde International Journal of Atmospheric Sciences, Volume 2013, Article ID 503727, 26 pages http://dx.doi.org/10.1155/2013/503727
George, I., Abbatt, J. Heterogeneous oxidation of atmospheric aerosol particles by gas-phase radicals. Nature Chem 2, 713–722 (2010). https://doi.org/10.1038/nchem.806
Bull, I., Parekh, N., Hall, G. et al. Detection and classification of atmospheric methane oxidizing bacteria in soil. Nature 405, 175–178 (2000). https://doi.org/10.1038/35012061
[10] Norman G. Loeb1 · Seung-Hee Ham2 · Richard P. Allan3 · Tyler J. Thorsen1 Benoit Meyssignac4 · Seiji Kato1 · Gregory C. Johnson5 · John M. Lyman5,6 Observational Assessment of Changes in Earth’s Energy Imbalance Since 2000 Surveys in Geophysics https://doi.org/10.1007/s10712-024-09838-8 , Shows warming due to energy imbalance due to cloud reduction
[11] Frank, P. Cenozoic Carbon Dioxide: The 66 Ma Solution. Geosciences 2024, 14, 238. https://doi.org/10.3390/geosciences14090238 Shows sea surface temperature to be determinent of global warmth.
[12] Koutsoyiannis D. Refined Reservoir Routing (RRR) and Its Application to Atmospheric Carbon Dioxide Balance. Water. 2024; 16(17):2402. https://doi.org/10.3390/w16172402 Analysis that uses different technique to show that CO2 residence time is 4 years
[13] Nikolov, N.; Zeller, K.F. Roles of Earth’s Albedo Variations and Top-of-the-Atmosphere Energy Imbalance in Recent Warming: New Insights from Satellite and Surface Observations. Geomatics 2024, 4, 311-341. https://doi.org/10.3390/geomatics4030017 Shows warming of last 20 years totally due to solar forcing - not CO2
[14] Wong, E. W., & Minnett, P. J. (2018). The response of the ocean thermal skin layer to variations in incident infrared radiation. Journal of Geophysical Research: Oceans, 123, 2475-2493. https://doi.org/10.1002/2017JC013351 . Shows that back radiation cannot warm oceans
[15] Demetris Koutsoyiannis. Stochastic assessment of temperature–CO2 causal relationship in climate from the Phanerozoic through modern times[J]. Mathematical Biosciences and Engineering, 2024, 21(7): 6560-6602. doi: 10.3934/mbe.2024287 Temperature changes determine CO2
[16] Roy Clark A nobel prize for climate errors. Science of Climate change Vol. 4.1 (2024) pp. 1-73 https://doi.org/10.53234/SCC202404/17
[17] Frank, Patrick. 2024. “Cenozoic Carbon Dioxide: The 66 Ma Solution” Geosciences 14, no. 9: 238. https://doi.org/10.3390/geosciences14090238
[18] Kangwei Li, Yunlong Guo, Sergey A. Nizkorodov, Yinon Rudich, Maria Angelaki, Xinke Wang, Taicheng An, Sebastien Perrier, Christian George. Spontaneous dark formation of OH radicals at the interface of aqueous atmospheric droplets. Proceedings of the National Academy of Sciences, 2023; 120 (15) DOI: 10.1073/pnas.2220228120
[19] Nicely, J. M., Canty, T. P., Manyin, M., Oman, L. D., Salawitch, R. J., Steenrod, S. D., et al. (2018). Changes in global tropospheric OH expected as a result of climate change over the last several decades. Journal of Geophysical Research: Atmospheres, 123, 10,774–10,795. https://doi.org/10.1029/2018JD028388
[20] Liu, Q. , Du, G. , Li, X.-J. , Liu, J. , Meng, N. , Li, C.-Y. , et al. (2024). Dynamics and controls of methane oxidation in the aerobic waters of Eastern China marginal seas. Journal of Geophysical Research: Oceans, 129, e2023JC020280.
[21] Allen, M.R., Shine, K.P., Fuglestvedt, J.S. et al. A solution to the misrepresentations of CO2-equivalent emissions of short-lived climate pollutants under ambitious mitigation. npj Clim Atmos Sci 1, 16 (2018) https://doi.org/10.1038/s41612-018-0026-8
[22] University of California - Irvine. (2023, April 7). Scientists discover a way Earth’s atmosphere cleans itself. ScienceDaily. Retrieved September 10, 2024 from www.sciencedaily.com/releases/2023/04/230407133443.htm
[23] Kangwei Li, Yunlong Guo, Sergey A. Nizkorodov and Christian George Spontaneous dark formation of OH radicals at the interface of aqueous atmospheric droplets. PNAS https://doi.org/10.1073/pnas.2220228120
[24] Berry Ed Science of Climate Change Nature contols CO2 Increase https://doi.org/10.53234/scc202301/21
[25] Donna Laframboise; The Delinquent Teenager Who Was Mistaken for the Worlds Top Climate Expert.p46
[26] Worden, J.R., Bloom, A., Pandey, S. et al. Reduced biomass burning emissions reconcile conflicting estimates of the post-2006 atmospheric methane budget. Nat Commun 8, 2227 (2017).https://doi.org/10.1038/s41467-017-02246-0
[27] Feng, L., Palmer, P.I., Zhu, S. et al. Tropical methane emissions explain large fraction of recent changes in global atmospheric methane growth rate. Nat Commun 13, 1378 (2022). https://doi.org/10.1038/s41467-022-28989-z
Appendix 1 Calculation Of Feedback.
From first principles
To simplify our discussion in previous e-mails, let’s denote the temperature and forcing increments by dT —> T and dF —> F. We calculated the feedback-free relation between forcing increment and temperature increment
T= α F
Here the coefficient a can be thought of as the feedback-free “amplification” by the climate system. The climate system amplifies the forcing increment F to the temperature increment T. So the amplification a has the units of C m2W-1.
The idea of feedback is that a portion βT of the temperature increment gets added to the original forcing F so the amplifier equation becomes
T= α (F+ βT)
Here β is the “feedback parameter. If β >0 the feedback is said to be positive, if β<0 the feedback is said to be negative, and if β=0 the system if feedback-free.
Solving the equation above for T in terms of F we find
T= [α/(1-αβ)]F = α’ F T=α’F
The coefficient of F is the amplification with feedback, which we can denote by a’ , where
α’ = α/(1-αβ)
For positive feedbacks, the amplification with feedback will be larger than the feedback-free amplification,
α’ > α/(1-αβ) for 0<β<1/α
In fact, as The coefficient of F is the amplification with feedback, which we can denote by a’ , where
α’ = α/(1-αβ)
For positive feedbacks, the amplification with feedback will be larger than the feedback-free amplification,
α’ > α/(1-αβ) for 0<β<1/α
In fact, as
β → 1/α α’ → 8
The amplification becomes infinite for sufficiently large positive feedback parameters b. For positive feedback values larger than the limit 1/a the amplification is negative, with the physically absurd implication that adding greenhouse gases cools the Earth. But IPCC is not all that far from this absurd limit, a point Dick Lindzen has made for many years.
For negative feedbacks, the amplification with feedback a’ will be less than the feedback-free amplification a
α’ < α(1-αβ) for β<0
The coefficient of F is the amplification with feedback, which we can denote by a’ , where
α’ = α/(1-αβ)
For positive feedbacks, the amplification with feedback will be larger than the feedback-free amplification,
α’ > α/(1-αβ) for 0<β<1/α
In fact, as
β → 1/α α’ →∞
For negative feedbacks, the amplification with feedback amplification =
a’ will be less than the feedback-free
α’’ < α’/(1-αβ) for β<0
For example, if αβ = -1 then α’ >α/2
This equation; dT=α’dF
is the inverse of that used by the IPCC and gives the correct relationship between feedback and forcing, So an increase in feedback increases forcing as would be expected.
Calculation Of Temperature From Forcing
Letting T be some hypothetical representative temperature, to good approximation the flux emitted by Earth to space is given by the T4 law
Z= ε σ T4 = 277 W m-2
Here A is the thermal emissivity coefficient of the Stefan Boltzmann law, that we have written above, σ is the Stefan-Boltzmann constant, and T is some representative, absolute temperature. Increasing the concentration of greenhouse gases makes the emissivity smaller. We have just calculated that for doubling CO2
dε/ε = - 1.1%.
dT =- (1/4)(dε/ε) T.
Taking T = 290 K this gives a temperature increase from doubling CO2 of
dT = -(1/4)(- 1.1%)290 K = 0.8 K = 0.8 °C. for doubling CO2.
Doubling methane has no more than ¼ of the forcing from doubling CO2 and would take centuries to happen. But it would increase the temperature by
dT = 0.2 C for doubling CH4.
To put this discussion into IPPC-speak, from inspection of the arguments above, you will see that we have shown that the feedback-free rate of change of temperature with forcing is
a = dT/dF = T/(4es T4) = 290 K/(4 x 277 Wm-2) = 0.26 C m2W-1
So a forcing of dF = 3 W m-2 from doubling CO2 should cause a temperature increase of
dT= a dF = 0.8 °C,
the same number we estimated above with more emphasis on the basic physics